
Earning Potential
A coastal town at dusk, houses lit among the palms

The opportunity

Travel demand is growing.Property performancestill has to be earned.

A market view built from published data, with the sources visible and the limits stated.

Data last reviewed: August 2026

  1. 2019

    17.91 million

    International tourist arrivals

  2. 2024

    20.57 million

    International tourist arrivals, approximately 14.8% above 2019

  3. 2024

    2.948 billion

    Domestic tourist visits

  4. 2025

    4.287 billion

    Domestic tourist visits, per the current data portal

Post-pandemic recovery

India's largest travel engine is domestic.

Travel is cyclical, but the scale of India's domestic visitor economy and continued tourism growth creates a substantial accommodation market.

  1. 2019

    17.91 million

    International tourist arrivals

    Ministry of Tourism, Government of India

  2. 2024

    20.57 million

    International tourist arrivals, approximately 14.8% above 2019

    Ministry of Tourism, Government of India

  3. 2024

    2.948 billion

    Domestic tourist visits

    Ministry of Tourism, Government of India

  4. 2025

    4.287 billion

    Domestic tourist visits, per the current data portal

    Ministry of Tourism, Government of India  ·  Provisional

Sources

Data last reviewed: August 2026

  1. 01

    Ministry of Tourism, Government of India

    India Tourism Data / India Tourism Statistics

    https://tourism.gov.in/market-research-and-statistics

    Accessed August 2026

    Domestic Tourist Visits count visits, not unique travellers; a single trip across several states is counted in each state.

  2. 02

    Ministry of Tourism, Government of India

    India Tourism Data Portal

    https://indiatourismstats.gov.in/

    Accessed August 2026

    Portal figures are revised as states report. Treat the most recent year as provisional.

Market statistics describe broader short-term rental activity and do not represent a forecast for any individual Timeless property. Property performance varies materially by location, property type, condition, amenities, availability, competition, pricing and operating costs.

A definition worth keeping straight

Foreign Tourist Arrivals and International Tourist Arrivals are not the same measure. In 2024, India recorded 9.952 million foreign tourist arrivals and 20.57 million international tourist arrivals. Domestic Tourist Visits count visits rather than unique travellers, so one trip across several states appears more than once.

Economic scale

What the sector is worth.

The World Travel & Tourism Council measures the total contribution of travel and tourism, including indirect and induced effects.

01

25.24

Lakh crore

Travel & tourism contribution to GDP

USD 263.6 billion as published

India  ·  2025

Source: World Travel & Tourism Council

02

46.2 million

Jobs supported by travel and tourism

India  ·  2025

03

7.3%

Travel and tourism sector growth

India  ·  2025

04

₹19.44 lakh crore

Domestic visitor spending, approximately 86% of sector spending

India  ·  2025

Forecasts, to be read as forecasts

8.5%

Forecast travel and tourism GDP growth

2026  ·  Forecast

Forecast, not a recorded outcome. WTTC projects a contribution of approximately USD 286.1 billion, about ₹27.40 lakh crore.

₹50.47 lakh crore

Projected travel and tourism economy

2036  ·  Forecast

A ten-year projection. Long-range projections carry wide uncertainty.

Sources

Data last reviewed: August 2026

  1. 01

    World Travel & Tourism Council

    Economic Impact Research: India

    https://wttc.org/research/economic-impact

    Accessed August 2026

    WTTC measures the total contribution of Travel & Tourism, including indirect and induced effects.

Market statistics describe broader short-term rental activity and do not represent a forecast for any individual Timeless property. Property performance varies materially by location, property type, condition, amenities, availability, competition, pricing and operating costs.

Alternative accommodation

Home-based accommodation is already part of India’s visitor economy.

Around 91% of Airbnb guests in India in 2024 were domestic travellers, and non-urban gross booking value tripled between 2019 and 2024.

INR 113 billion

Estimated contribution of Airbnb activity to GDP

111,000

Jobs supported by Airbnb activity

INR 24 billion

Wage income associated with Airbnb activity

Sources

Data last reviewed: August 2026

  1. 01

    Oxford Economics

    The economic impact of Airbnb in India, research commissioned by Airbnb

    https://news.airbnb.com/en-in/

    Accessed August 2026

    Commissioned and funded by Airbnb. Read as platform-sponsored research, not independent analysis.

Market statistics describe broader short-term rental activity and do not represent a forecast for any individual Timeless property. Property performance varies materially by location, property type, condition, amenities, availability, competition, pricing and operating costs.

Disclosure

Who paid for this research matters.

These figures come from Oxford Economics research commissioned and funded by Airbnb. That does not make them wrong, but it does make them platform-sponsored rather than independent, and they should be read that way.

Short stay vs long lease

The relevant comparison is property-specific net income.

Conventional residential leasing often produces comparatively modest gross rental yields, while short-term accommodation provides the ability to price individual nights around demand. That can create stronger gross-income potential in suitable properties, but it also introduces operating costs and demand risk.

You will find claims online that short-stay letting earns a fixed multiple of long-term rent. We do not publish figures like that, because a national multiple tells you nothing about a specific home in a specific street.

5.16%

Average gross residential rental yield across surveyed Indian cities

Q2 2026  ·  Third-party estimate

Gross rental yield, before expenses. An average across surveyed cities, not a figure for any individual property.

Sources

Data last reviewed: August 2026

  1. 01

    Global Property Guide

    India residential rental yields

    https://www.globalpropertyguide.com/asia/india/rental-yields

    Accessed August 2026

    Third-party estimate. Gross yield, before operating costs, taxes and vacancy.

Market statistics describe broader short-term rental activity and do not represent a forecast for any individual Timeless property. Property performance varies materially by location, property type, condition, amenities, availability, competition, pricing and operating costs.

Market variability

Averages hide the thing you need to know.

Three Indian markets, the same twelve months, three different stories. Then two neighbourhoods inside one of them, moving in opposite directions.

Karnataka

Bangalore Urban

Active listings
14,784
Average nightly rate
₹3,160

USD 33 as published

Avg. annual revenue
₹2.59 lakh

USD 2.7K as published

Occupancy

45%

  • Revenue YoY +30.6%
  • Supply YoY +47.6%

Revenue rising quickly, but supply is rising faster. A market where positioning and pricing decide who captures the growth.

Maharashtra

Mumbai

Active listings
7,086
Average nightly rate
₹5,750

USD 60 as published

Avg. annual revenue
₹5.36 lakh

USD 5.6K as published

Occupancy

46%

  • Revenue YoY +12.8%
  • Supply YoY +25.7%

A higher rate market growing steadily, with supply expanding at roughly twice the pace of revenue.

Goa, statewide

Goa

Active listings
6,953
Average nightly rate
₹7,180

USD 75 as published

Avg. annual revenue
₹5.27 lakh

USD 5.5K as published

Occupancy

43%

  • Revenue YoY -12.2%
  • Occupancy YoY +19.5%
  • Supply YoY +26.0%

Occupancy up, average revenue down. More nights sold at lower rates, against 26% more competing supply.

Rupee figures converted from the published US dollar values at ₹95.76 to USD 1, the European Central Bank reference rate for 24 August 2026.

South Goa

Cavelossim

Active listings
127
Average nightly rate
₹6,800

USD 71 as published

Avg. annual revenue
₹6.61 lakh

USD 6.9K as published

Occupancy

50%

  • Revenue YoY +26.0%

A small, tightly held market where average revenue rose 26% year over year.

North Goa

Calangute

Active listings
1,526
Average nightly rate
₹7,570

USD 79 as published

Avg. annual revenue
₹5.27 lakh

USD 5.5K as published

Occupancy

40%

  • Revenue YoY -25.1%

Twelve times the supply, a higher nightly rate, and average revenue down 25.1% year over year.

Rupee figures converted from the published US dollar values at ₹95.76 to USD 1, the European Central Bank reference rate for 24 August 2026.

The shape of a seasonal year
Demand Running costs
Jan Feb Mar Apr May Jun Jul Aug Sep Oct Nov Dec

The peak carries the year. In the shaded months the property still costs money to hold: utilities, society charges, connectivity, maintenance and statutory charges do not pause.

This is why a strong month annualised is a bad forecast, and why we ask what a property does in its worst three months rather than its best one.

An illustrative shape, not measured data. Every market has a different year, and some have almost no season at all.

AirDNA data updated 5 August 2026, reflecting completed data through July 2026. Whole-market estimates derived from platform listings, not Timeless performance.

Sources

Data last reviewed: August 2026

  1. 01

    AirDNA

    Short-term rental market data

    https://www.airdna.co/vacation-rental-data

    Accessed August 2026

    Data updated 5 August 2026, reflecting completed data through July 2026. AirDNA figures are estimates derived from scraped platform listings and reflect the whole market, not any single operator.

Market statistics describe broader short-term rental activity and do not represent a forecast for any individual Timeless property. Property performance varies materially by location, property type, condition, amenities, availability, competition, pricing and operating costs.

Regulation

Short-term rental is a local operating business.

Rules may differ between states, municipalities, property types, individual buildings, housing societies and accommodation classifications.

Current Government of Goa guidance has explicitly reminded operators using Airbnb and similar short-term rental services that applicable Tourism Department registration is required. That is a Goa requirement. It does not describe the rules anywhere else in India, and nothing on this page should be read as legal advice for a specific property.

Regulatory feasibility is one of the first things Timeless checks before recommending an operating model.

Sources

Data last reviewed: August 2026

  1. 01

    Department of Tourism, Government of Goa

    Registration guidance for tourist accommodation

    https://www.goatourism.gov.in/

    Accessed August 2026

    Applies to Goa only. Every state, municipality and building may treat short-stay accommodation differently.

Market statistics describe broader short-term rental activity and do not represent a forecast for any individual Timeless property. Property performance varies materially by location, property type, condition, amenities, availability, competition, pricing and operating costs.

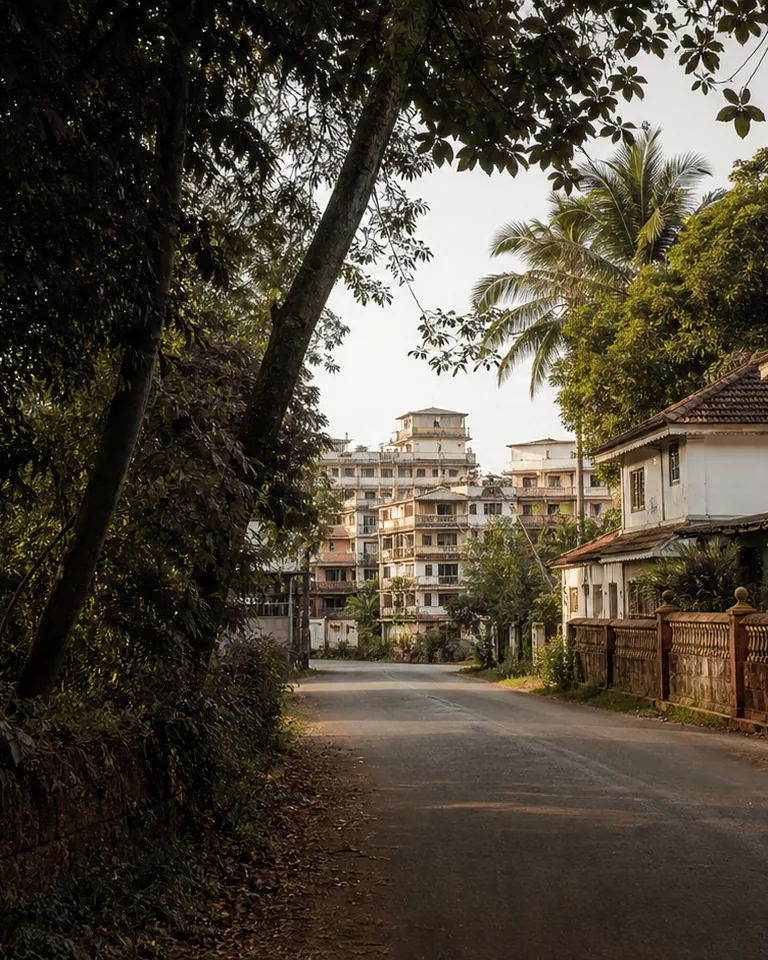
A residential lane of houses and low buildings under palms

Sources

Every figure on this page is traceable.

Market statistics describe broader short-term rental activity and do not represent a forecast for any individual Timeless property. Property performance varies materially by location, property type, condition, amenities, availability, competition, pricing and operating costs.

Data last reviewed: August 2026

Sources

Data last reviewed: August 2026

  1. 01

    Ministry of Tourism, Government of India

    India Tourism Data / India Tourism Statistics

    https://tourism.gov.in/market-research-and-statistics

    Accessed August 2026

    Domestic Tourist Visits count visits, not unique travellers; a single trip across several states is counted in each state.

  2. 02

    Ministry of Tourism, Government of India

    India Tourism Data Portal

    https://indiatourismstats.gov.in/

    Accessed August 2026

    Portal figures are revised as states report. Treat the most recent year as provisional.

  3. 03

    World Travel & Tourism Council

    Economic Impact Research: India

    https://wttc.org/research/economic-impact

    Accessed August 2026

    WTTC measures the total contribution of Travel & Tourism, including indirect and induced effects.

  4. 04

    Oxford Economics

    The economic impact of Airbnb in India, research commissioned by Airbnb

    https://news.airbnb.com/en-in/

    Accessed August 2026

    Commissioned and funded by Airbnb. Read as platform-sponsored research, not independent analysis.

  5. 05

    AirDNA

    Short-term rental market data

    https://www.airdna.co/vacation-rental-data

    Accessed August 2026

    Data updated 5 August 2026, reflecting completed data through July 2026. AirDNA figures are estimates derived from scraped platform listings and reflect the whole market, not any single operator.

  6. 06

    Global Property Guide

    India residential rental yields

    https://www.globalpropertyguide.com/asia/india/rental-yields

    Accessed August 2026

    Third-party estimate. Gross yield, before operating costs, taxes and vacancy.

  7. 07

    European Central Bank

    Euro foreign exchange reference rates, USD/INR cross rate

    https://www.ecb.europa.eu/stats/policy_and_exchange_rates/euro_reference_exchange_rates/html/index.en.html

    Accessed August 2026

    Reference rate for 24 August 2026, used to convert figures that their publishers report in US dollars. Rupee figures on this site are converted at this rate and are not the publisher's own numbers.

  8. 08

    Department of Tourism, Government of Goa

    Registration guidance for tourist accommodation

    https://www.goatourism.gov.in/

    Accessed August 2026

    Applies to Goa only. Every state, municipality and building may treat short-stay accommodation differently.

Market statistics describe broader short-term rental activity and do not represent a forecast for any individual Timeless property. Property performance varies materially by location, property type, condition, amenities, availability, competition, pricing and operating costs.

A lit apartment seen from the balcony at dusk

Your property, not the market

The market is context.Your property is the question.

Bring the property, the location and the numbers. We will tell you what needs to be true for the model to work.